Saturday, December 25, 2010

Forex : More in Technical Indicators

Previously I did mention about Moving Average, Support & Resistance and MACD. These are the technical indicators that usually use in Forex & also Stock trading.


Technical indicators classified into two groups:
1. Non-trending indicators, also known as Oscillators. For instance, RSI & Stotchastic are useful for non-trending market. Non-Trending market mean market is usually moving sideways to make up consolidation pattern.
2. Trend following indicators, eg Moving Average follow trend. They will get you into the trend until there is a trend change. Trend following indicators will produce noise, where we refer as Whipsaw.


Moving Average:
1. Using single moving average:
A price crossing of the moving average provides buy/sell signal. Buy when price is above MA, sell when price is below MA.The disadvantage of single MA is you will encounter price crossing MA & again crossing, this phenomenon we called as whipsaw, it's common when price is at consolidation or sideway.


2. Using Double moving average:
Also known as double crossover method. When using two MA, buy signal is produce when a faster MA cross above a slower MA, sell signal when faster MA cross below a slower MA.
Using Double MA will cut off whipsaws but it normally will result time lag.


3. Using three Moving Average
Buy signal is produced when the fastest MA crosses above both the slower MA, a sell signal when the fastest MA crosses below both slower MA.Using three MA will take the slowest MA as a trend indicator & use the crossover of the other two MA as sell or buy signal.


Summary:
The moving average is calculated from a series of past data, the data will have a time lag. The greater the number of periods, will lead to greater time lag. However, the smaller number of periods will lead to more sensitive data, thus will cause whipsaw due to lots of signals. When using MA, we need to try to form a balance. One way is use MA conjunction with another indicator. Both indicators will help to confirm each other on signal.

Moving Average Convergence & Divergence Indicator (MACD)
Earlier I mentioned about MACD, I would like to share more about MACD.
In MACD, we always look at the:
1. Zero Line crossovers - when MACD crosses below zero line, a sell signal generated while a buy signal when it is above zero line.
2. Signal Line crossovers - If MACD line crosses the signal line to the upside, a buy signal, conversely when crosses  signal line at downside, it is a sell signal. The location of the crossover also important indicate how strong of the trend. A bullish crossover of the MACD & signal line below zero is more bullish.
3. Divergence - As mentioned in earlier post, MACD divergence is the most important indicator to identify a reversal. To review, please review again : MACD in earlier post.

Summary:
To me, MACD is most powerful indicator when come to identify the trend using convergence & divergence. These will give a powerful signal for reversal. The rule of thumb, a strong buy/sell signal still come from price pattern & price action.

Relative Strength Index (RSI)
RSI is one of the simplest indicators & among the favourites in trading. RSI basically measures market internal strength and give an indication of overbought & oversold market condition. A reading of above 70 indicates a overbought market, a reading below 30 indicates a oversold market. We use RSI for:
1. Tops & bottom - as mentioned, it show overbought & oversold.
2.Support & resistance - RSI who the level of support & resistance, where we can predict price support & resistance.
3. Divergence - Similar to MACD, it's a reversal trend change.
Summary:

Using overbought & oversold sometimes be misleading. When market is strong, it tends to go overbought & stay for a period of time. The RSI work best when market is in non-trending condition.

So far, you will realize that an individual indicator may not work in all market condition, so we need to combine one indicator with another to increase the efficiency of the indicators across all markets.

There are many resources that you can find out from Amazon to enhance your skill in technical analysis, below are some recommend resources:


Thursday, December 23, 2010

Forex : Charting Again

Basic about BAR chart, it use to convey information of Open, High, Low & Close.


Earlier Post I did highlight about some basic about Price actions, if you want to recall, you may want to go back refresh it again, or click the link : http://myacbookscafe.blogspot.com/2010/12/forex-price-actions.html

Here I would like to share some of the common Bar type that may help during trading.

Bullish Reversal Bar:
Characteristic:
A long seller bar, follow by a small buyer bar. Then, 3rd buyer car is more than 50% of the 1st seller bar.
- The 3 bar pattern usually formed after a decline and is a reversal pattern.

Bearish Reversal Bar:

Characteristic:
A large buyer bar follow by a small buyer bar, then 3rd seller bar that 50% more than 1st Bar.
- The bars usually formed after a price rally, and is a reversal.

Doji:


Characteristic:
The open & close are the same price. It's mean there is indecision in the trading direction.

Doji Bullish Reversal:
Characteristic:
A Seller bar, followed by a Doji. Then, 3rd bar is buyer that close to the first seller bar.
- it formed a decline & a reversal happen.

The above are just few more of the bar pattern analysis.You can read the George Morris book below for more about charting.


Saturday, December 18, 2010

Forex : More on Forex Market Moving Driver

The previous post I highlight about the drivers who will move Forex, you may refer back if you miss it:
Forex: Who & What Drive the Market

Market moving on demand & supply, and Fundamental news, economic data, political and natural disaster affect  market sentiment, thus affect Demand & Supply.

Fundamental News:
1. Interest Rates - one of the most important fundamental news. Example for USD/JPY. If the Bank of Japan decided to increase interest rate, the Yen will strengthen against USD. Good for the term currency. Conversely if Federal Reserve Bank(FED) to increase interest rate, you will want to buy USD/JPY for long.

2. Non-farm Payroll(US) - releases on the first Friday of the month, job created by the economy outside the farming area.A good economy is good for the currency.

3. Employment report(US) - lower employment rate, it's shown a strong economy. Good for the currency.

4. Gross Domestic Production(US) - GDP is total amount of goods & services produced in United States. A strong GDP lead to strong economy, strong currency.

5. Producer Price Index (PPI) - Measures the cost of producing goods, also an indication of production inflation. The FED will take action on interest rate to inflation.

6. Purchasing Manager Index (PMI) - Tracks the manufacturing condition is US. An increase mean strong economy.

7. Consumer Price Index (CPI) - Measures of goods paid by consumer. Increase of CPI with an increase of inflation.

8. Consumer Confident Index (CCI) - Survey of consumer confident. A high level of CCI mean a strong economy, it will strengthen currency.

9. Retail Sales - Indicator of consumer spending in both durable & non-durable product and services. A strong number mean strong economy.

I focus on USD because all the four major pairs involve USD. If you trade USD/JPY, you would like to focus also on Japan fundamental data. As Europe, not only focus on Euro data, but may focus on individual country data, eg like German because German is the largest economy is Europe Union.

For more on Fundamental Data, you can go to : http://www.forexfactory.com/

Major political events will affect the currency rate. Eg, when there is political election in Japan, there are un-certainties on the winner and the next prime minister. The uncertainties tends to strengthen or weaken the currency.

Natural disaster always bad for the country. It will cause lots for economy recovery, it may affect the GDP of the country.

Friday, December 17, 2010

Forex : Risk Management & Psychology

Last but not least, the most important part in Forex trading is on how to manage risk & how to prepare yourself to trade successfully in trading.

Forex always referred to as the WORLD LARGEST CASINO! Risk management is extremely important because of the following reasons:

1. It's involve a lot of leverage, it can up-to 100:1, 200:1.
2. It's need to adhere to the trading principle, many people get blown out because they don't understand leverage & do not follow their trading principle.
3. You can get rich fast, also lose it fast!
4. The speed of execution & liquidity induces gambling.

To be able to become extremely success in Trading, prepare yourself:
1. Set a goal.
2. Use every trading session as a learning experience, learn from failure..
3. Acting your trading principle & strategy in disciplined way.
4. Don't let emotionally decide your trading way.

There are so much more factors we need to practice & caution on trading such a high liquidity Market.
For me, continue to follow through strategy, learn from expert, read more news & forum, practice..practice & continue practice..

Ultimately, the believe in Trading toward my GOAL of FINANCIAL FREEDOM.

Thursday, December 16, 2010

Forex : Price Cycle

To become a successful trader, we must really understand the stage of the current price cycle we are in. Over the long run in trading, they will be always up-down, up-down. It's very important the time we get in & get out from the trend. As a rule: we enter the pull back..example:


In real trading world, the cycle rarely form perfectly symmetrical shape that we can easily identified. Therefore, we must know how to read chart by different time frame, to compare & confirm the cycle that we in. Entering a wrong cycle can pay you a lot.

A typical trading cycle, always accompanied by changes in Volume & Oversize Bar,see below example:

The typical case not really happen in the real trading like I shown above, above just for illustration of the trading cycle.

Forex : MACD

MACD - is short form of Moving Average Convergence-Divergence. In Stock technical analysis, MACD usually use for signal line crossovers, centerline crossovers and divergences to generate signals.


Below an example use in Stock:


In Forex, we use MACD for Convergence & Divergence.
Divergence means disagreement, Convergence means agreement.


MACD should be the same with price action, therefore when price makes a new high, so do MACD. If the pattern is not repeated, then you'll have a Divergence.


Divergence is the strongest technical analysis in Forex. Let's check the 2 Divergence : Bullish Divergence & Bearish Divergence.


Example: Bullish Divergence for USD/JPY, Daily Chart.


Example: Bearish Divergence for USD/JPY, Daily Chart.


Take note the MACD Divergence is a very powerful indicator of momentum change compare with MACD Convergence. It always show a bounce off from the previous trend.


Next, let's see how we can study the pulse of trading - Price Cycle.


Forex : Price Actions

Key Technical Analysis in Forex is identifying the price pattern, action & bouncing.
Check :
The currency bouncing off the pivot? support or resistance?
Check the daily chart to identify the trend?
Check hourly charts to identify support & resistance.

The are few typical price actions we can make use, it may use as Entry or Exit point.

1. Price Penetration - when the Bar, closes through the key level it breaks.

Price Penetration


2. Low Test Bar - The price is pulled down to extreme low, but buyer rejected the low & push the price significantly higher. The failed low test, indicates a buyer push the price higher.


3. High Test Bar - The price push up to high, but seller step in & push it significantly lower off its highs. This indicate strong selling & an indication of short.


These are some basics about price actions in Forex. Only the price bar action itself will not give enough power, with the combination of other indicators, it is massively power. Let's go to see how MACD use in Forex, how's different it compare with using in Stock analysis.


Monday, December 13, 2010

Forex : Support & Resistance

Price action provides all the clues.

Trading is finding & executing trades setups around the area of support & resistance.

The more factors that converge through a single boundary, the greater the probability it will support or resist price change.

The most important levels:
Look to buy at support when the nearest resistance is far above.
Look to sell at resistance when the nearest support is far below.

Identifying support & resistance is one of the method for entry.

To identify Triggering Point:

  1. Support & resistance analysis
  2. Pattern recognition
  3. Evaluation of Risk : Reward
  4. All chart time frame has the same trend.

Forex : Technical Analysis : Moving Average

Moving averages are used to smooth out short-term fluctuations, which can assist in highlighting longer term trends.
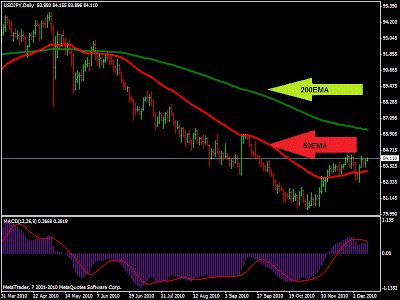
In Forex, I am usually using 50day EMA & 200EMA, using exponential instead simple because it apply more weight on the trend, it reduce the lag that common with Simple MA.

Identify the trend itself didn't help much on decide to LONG or SHORT, by applying EMA, we can actually understand if it is a right time to put LONG or SHORT.

EMA usually is applied to implicate a long & short position.
When price is above 50 EMA & 200 EMA, we'll put a long position.
When price is below 50 EMA & 200 EMA, we'll put a short position.

Setup 50EMA & 200EMA:
Draw 200EMA & 50EMA

Long Setup : above 50EMA & 200EMA

Short Setup: Below 200EMA & 50EMA